Surrounded and intersected by some of Tucson’s busiest roads, many students at the University of Arizona are constantly being exposed to air pollution caused from vehicular emissions as well as from combustion on campus grounds as they live, sleep, eat, work, and spend every hour of each day on campus. The university functions as its own ecosystem and micro city, meaning that students are exposed to both the city of Tucson’s air pollution as well as the pollution on campus.
While students and the campus community can only do so much to minimize their air pollution exposure, it’s a great first step to explore, track, and map the severity of exposures we’re up against.
The University of Arizona Air Pollution Sensor Network was created in the fall of 2021 by Dr. Chris Lim through a $7,500 grant from the Campus Sustainability Fund. This project aims to monitor air pollution on the UA campus so students, faculty, and staff can get a better idea of the air they breathe every day.
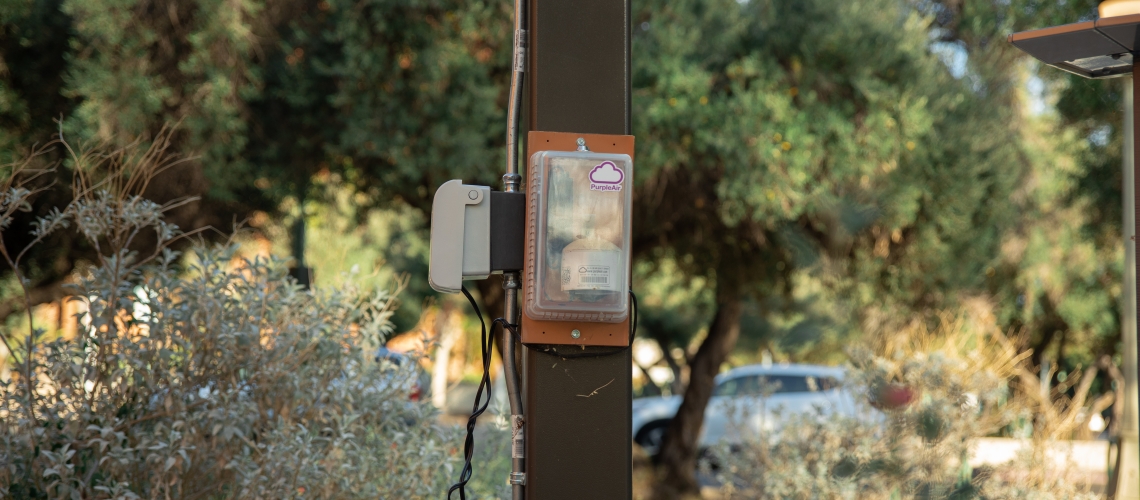
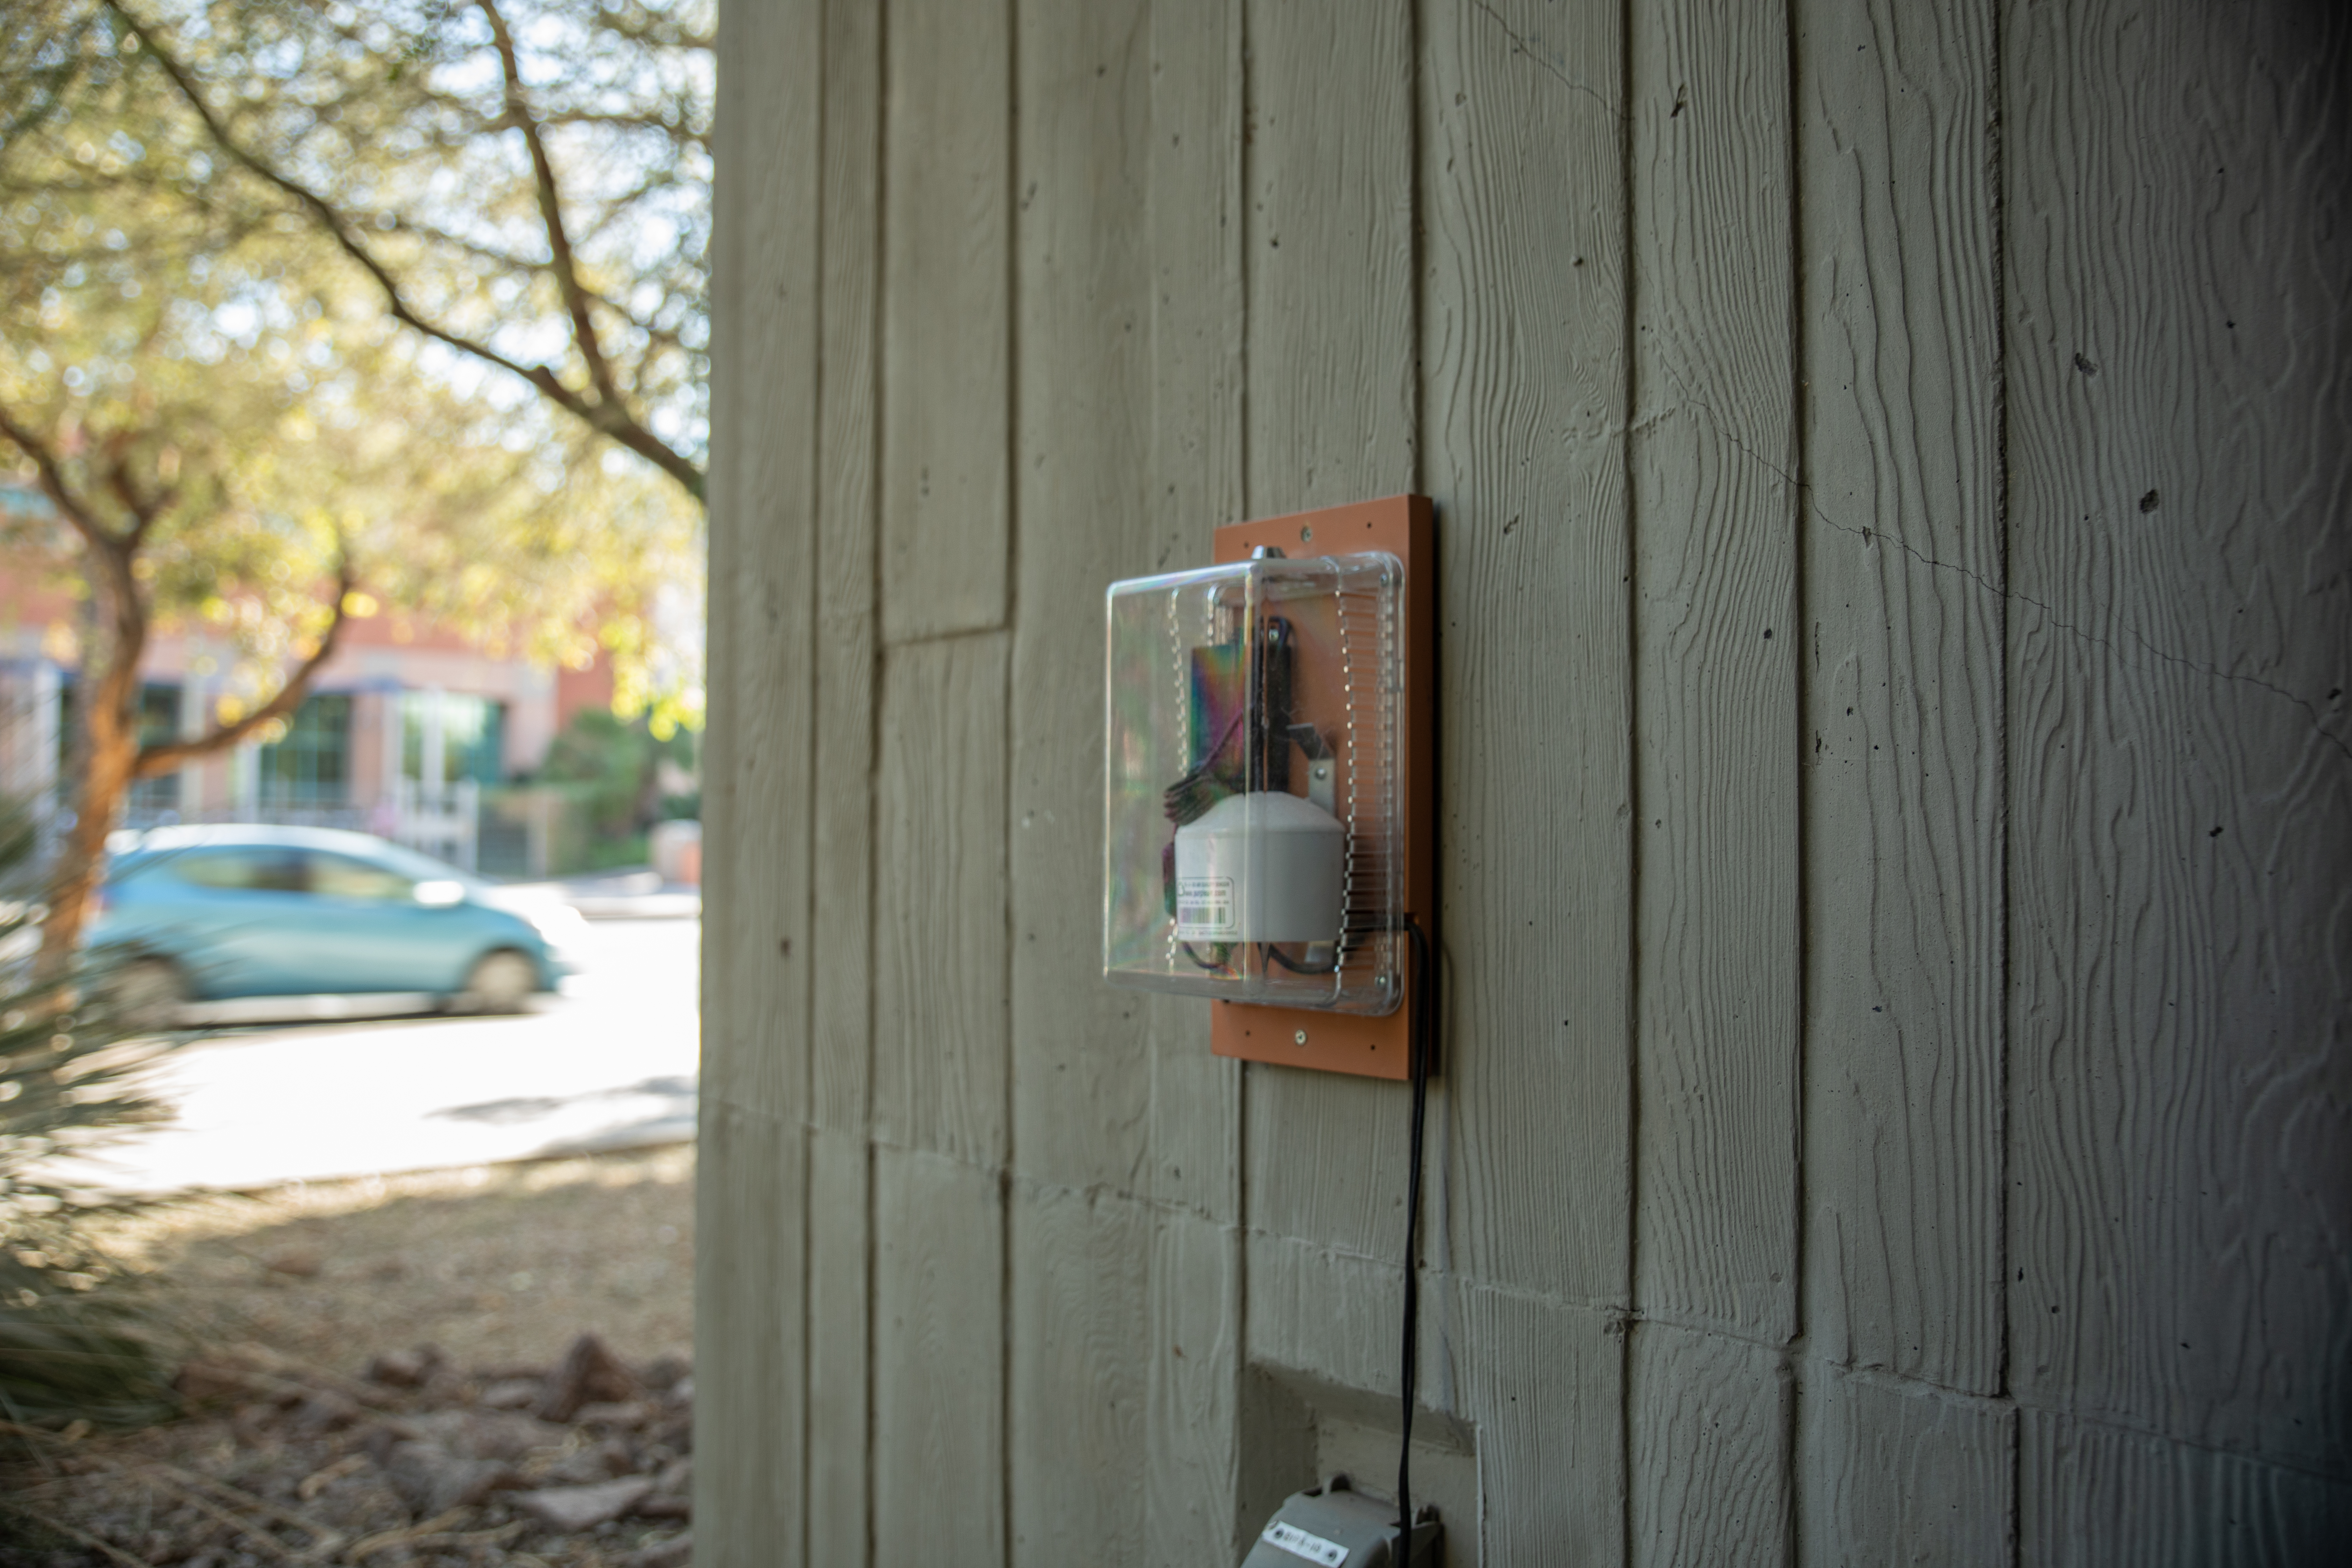
To do this, Project Manager Dr. Lim and his research team installed 20 PurpleAir sensors across campus in both high and low-trafficked areas- from anywhere between up north at the Honors College on Mabel, and all the way south to ENR2 on Sixth Street. PurpleAir Sensors are low-cost but highly effective air quality sensors that measure real-time PM2.5 concentrations. Dr. Lim and his team also launched a mobile sampling campaign, where students were enlisted to carry mobile air pollution sensors to and from their classes over the course of a week. This gave the researchers a more precise idea of the air students and campus-goers breathe on a day-to-day basis.
Using this information from students, as well as the 24/7 data being gathered by the 20 PurpleAir sensors, Dr. Lim and his team developed a real-time interactive map of air quality across campus. This map offers an easy and reliable way to check the levels of Particulate Matter 2.5 on and around the UA campus, boasting more precise data than a generic Google search could.
Particulate Matter 2.5 is one of the most common and harmful air pollutants and can be produced by vehicle exhaust, burning of fuels, dust, wildfires, and other natural and man-made sources. At only 2.5 millimeters across, these particles can easily make it into the respiratory tract and lungs, causing adverse health effects such as nose, throat, and lung irritation as well as coughing, sneezing, and shortness of breath. Exposure to PM 2.5 can also affect lung function, worsen asthma, and increase the risk of heart disease (US Environmental Protection Agency). Additionally, this study done by the Mel and Enid Zuckerman College of Public Health “found that air pollution is associated with worse brain health” and that the “benefits of physical activity... significantly diminished as air pollution increased” (Air Pollution Reduces Benefits of Exercise on the Brain). It’s clear the effects of air pollution are vast and impact health in ways we wouldn’t normally expect.
This is why Dr. Lim’s research is so valuable. The Air Pollution Sensor Network database that he has created to track PM2.5 includes some background information on the project, as well as tabs for the map itself, the raw data the sensors are collecting, and graphical trends summarizing the air quality at any given sensor location at any given time. This helpful resource offers the campus community the information they need to stay aware of air pollution levels and how they may be affecting us.

Dr. Lim and his team have found a wide variety of PM2.5 levels as they monitor air quality across campus. Some high levels of air pollutants are not surprising, such as outside the College of Law off of Speedway, where vehicles emitting pollutants pass at all hours of the day and most hours of the night. Some results were more unusual, however, such as surprising amounts— up to 8 micrograms of PM 2.5 per meter cubed of air— at the UA Community Garden on Mabel. For the most part however, Dr. Lim reports that “air quality has been generally very clean on campus so far,” though “Tucson air quality is generally a lot worse in the wintertime with high particulate matter levels, so we will probably observe this on the sensor network as well later in the year.”
For reference, the current US Environmental Protection Agency daily average for maximum PM2.5 exposure is 35 micrograms, and the annual average is 12 micrograms.
From their findings, it’s become clear that there are varied amounts exposure all across campus that need to be minimized wherever possible. To solve this problem, Dr. Lim and his team are continuously analyzing the data gathered to create Geographic Information System (GIS) models. These models will allow us to better understand air pollution trends around campus and predict what air pollution will look like moving forward. Additionally, Dr. Lim hopes this project will lead to changes in how the University manages air quality: “although reducing major sources like traffic would be difficult, actions such as planting more trees by major roads and changing behavioral patterns could reduce exposures.”
Dr. Lim and his team also hope to spread the Air Pollution Sensor Network wider, installing sensors in neighborhoods surrounding the University, such as Sam Hughes and Rincon Heights to get a better picture of air quality in our micro city. As the sensors collect more and more data, and the air pollution network expands as more sensor locations are added, the research team will be able to construct both new and improved models as well as possible solutions for the University of Arizona campus community should our air pollution levels rise.
Most importantly, Dr. Lim believes the information they’re gathering “will help the university and community members to better understand the temporal patterns of air quality and their personal level exposures.”
Exposure to pollutants from construction, dust storms, combustion, and vehicular emissions all result in negative health consequences that can have both short and long-term effects. Managing campus pollution is part of campus safety and the ongoing results of this network should be leveraged to create a path forward that is centered on human health.
